Building a CI/CD pipeline [Guide]
A CI/CD pipeline sits at the heart of your DevOps execution strategy. The right tool choices are critical to delivering high-quality code at high speed. Constant change makes it hard to tell when something significant has happened in real-time.
Not all advances in CI/CD tools are the same. For example, an IDE with a few more features might be better, but it might not be so beneficial that it is worth learning or adopting.
There is one area of the DevOps toolchain that has been screaming for years to get an update: real-time monitoring.
DevOps culture drives faster release cycles. Tools and techniques focus on this aspect of the CI/CD pipeline. However, the reality is that errors in production are inevitable. When mistakes do occur, without monitoring tools that rapidly direct teams to root cause solutions of those errors, the whole process breaks down.
Developers spend days, weeks, and sometimes months trying to reproduce production errors. Workarounds can create technical debt that bloats applications and pushes errors down the road. Production errors are often first identified by users and customers, damaging your brand and, ultimately, customer loyalty. Cloud-native environments compound all of these issues. The status quo doesn’t work, and a new solution is needed.
The ultimate CI/CD observability and monitoring solution are here. We are going to explain what that means, how it impacts the entire CI/CD pipeline, and why you should be excited!
The CI/CD pipeline explained
A quick refresher on the CI/CD pipeline.
CI/CD (or Continuous Integration / Continuous Deployment) is a process that developers use to ensure the proper progression of software through the development lifecycle. Its design is to be fast, automated, and responsive — taking small jobs from concept into production. Such performance is often achieved by parallelizing build and test phases.
The ultimate CI/CD approach allows for dynamic response to user feedback, changes in the market, and how applications perform in production. When it comes to error-free operations, that last point is the most important.
The stages within the CI/CD pipeline sometimes differ, and different labels are used. But, broadly, they are broken-down between build, automated/unit test, deploy, and monitor.
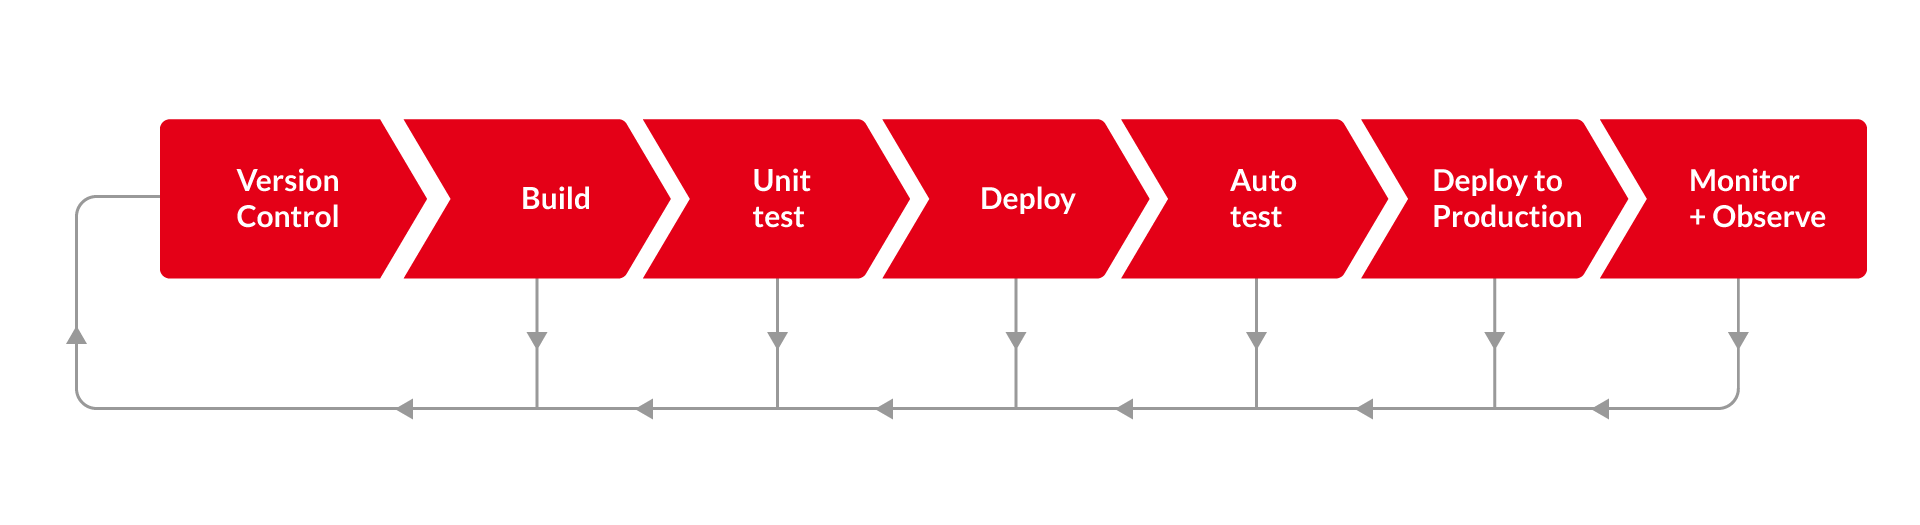
- Build: The code was written using several tools. This part of your CI/CD pipeline might involve version control software (e.g., Git and SVN), IDEs (e.g., Microsoft Visual Studios and NetBeans), automation build tools (e.g., Maven and Gradle), and container platforms (e.g., Docker, Kubernetes, and Nanobox). Specifically, for IDEs and automation build tools, the coding language you are using will impact your best choice.
- Automated/Unit Test: As code is being built, and once it is done, that code needs to be tested. This minimizes the release of the wrong code and helps developers check their output.
Unit test tools generally make up the first line of test defense. These assess specific code components (often as they are being written), looking for tiny glitches that might be harder to identify later.
Different unit test tools specialize in different languages. In every language, you want something fast, has a low impact on performance, and is flexible. xUnit (.NET Framework), JUnit (Java), and Unittest (Python) are all popular unit test tools.
Automated test tools are deployed later in the process to look at how code segments work as part of a whole. Automated test tools assess code in simulated production environments, testing functionality, and providing developers insight into the overall integrity of the application. Tools such as Selenium, Katalon Studio, and TestComplete are all accessible DevOps assets used within the CI/CD pipeline.
- Deploy: Once the code is finished and gone through initial tests, it is deployed. This is either into a test environment (for more auto testing) or straight into production. Deploy tools automate this process, integrating changes, pulling together little pieces, and acting as a hub that constructs the final product.
There are dedicated deploy tools like Octopus. Continuous integration tools, such as Jenkins, Travis CI, and TeamCity, also help deploy code. However, the role here is often to automate the interaction between different tools. Continuous integration tools play an essential role, particularly in build phases as well. Picking an excellent continuous integration tool is critical to streamlining your entire CI/CD pipeline.
- Monitor: DevOps assumes that code in production is not a finished product. Driven by the reality that specific idiosyncrasies in every production environment mean fool-proof testing is impossible. One of the most significant conceptual changes created by a DevOps and CI approach is to actively seek and use feedback on performance acquired in the production environment. To do this safely, Dev and Ops teams need observability over their code in production.
Traditional monitoring is undertaken with log monitoring collection tools and APM. These tools build on logging techniques that are slightly better than the last, but none answer the critical problem of “what did my software do?!”
The observability crisis in containers, microservices and serverless
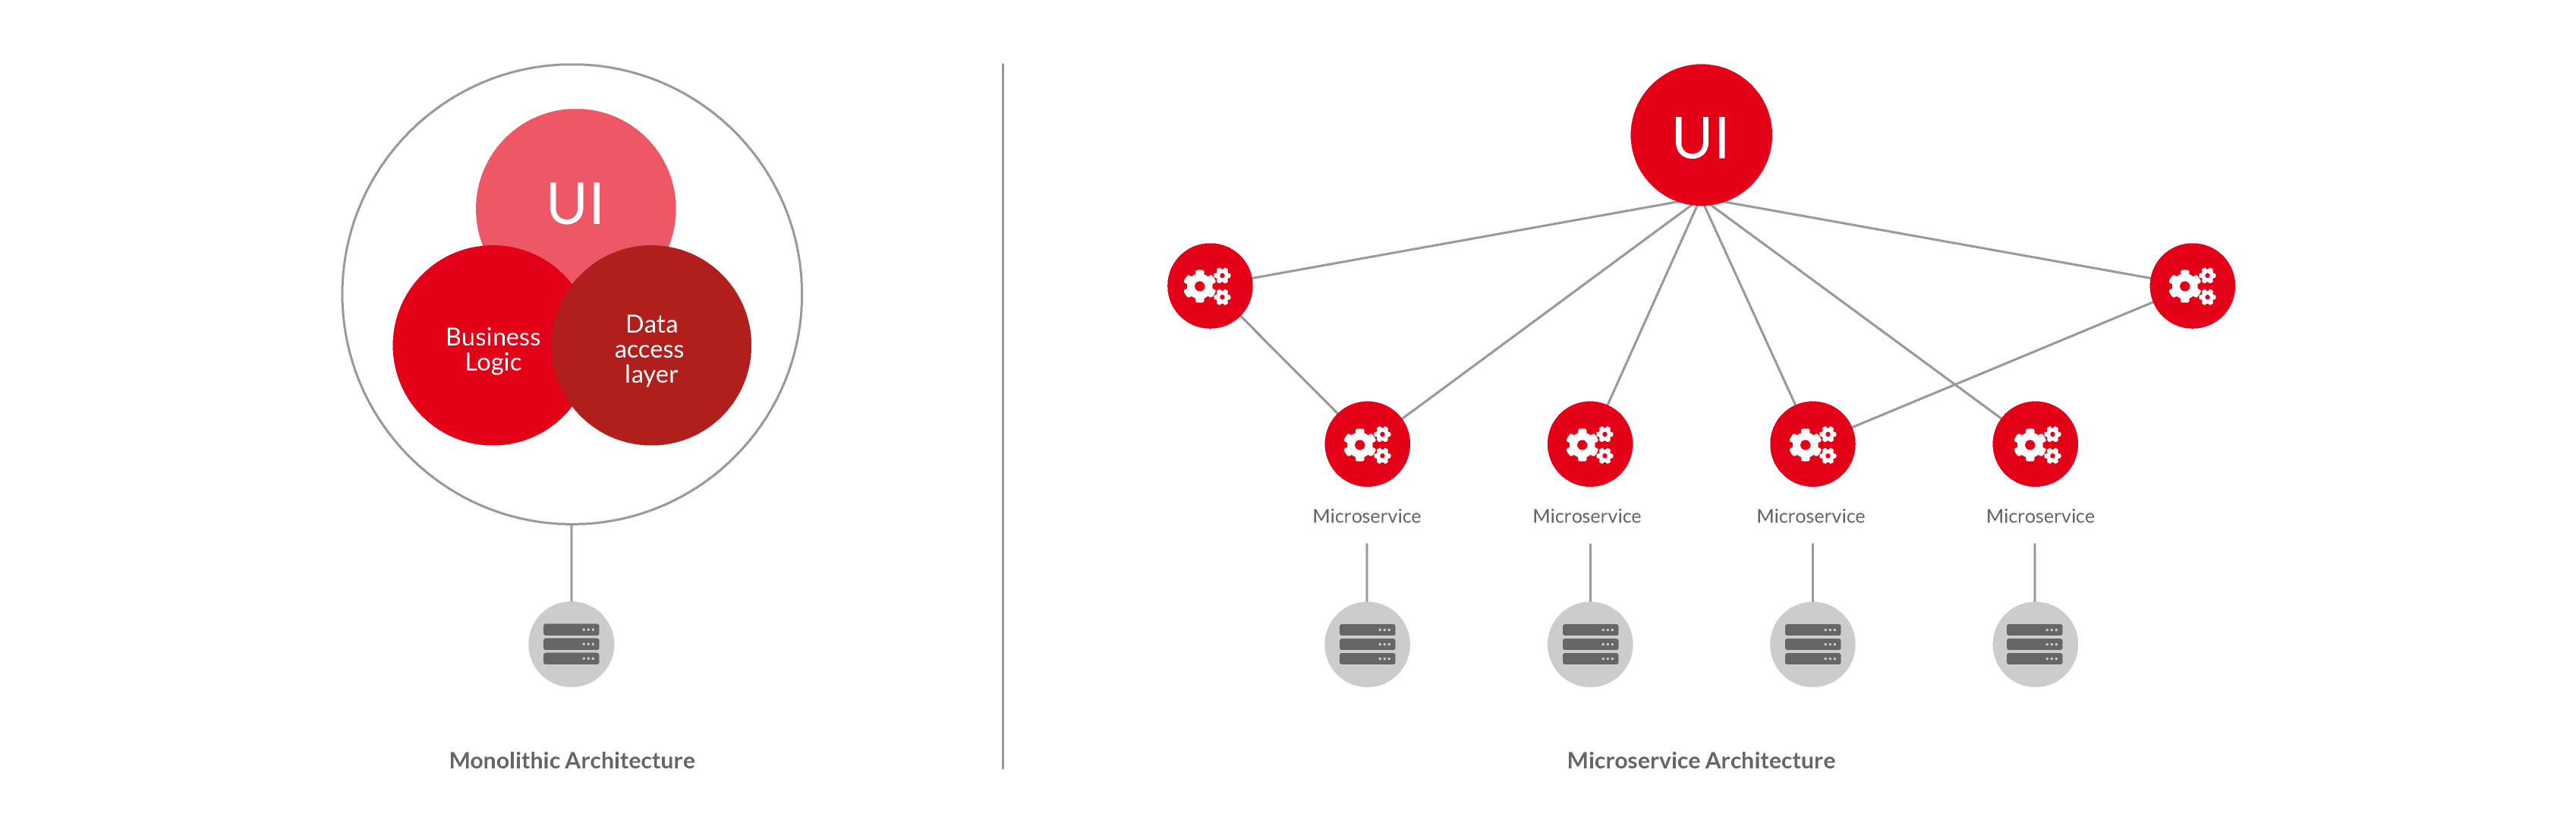
Containers, microservices, and serverless are the future of ”at scale’ scale’ application deployments, especially those enterprises who want to dominate the ”on-demand enterprise “movement that will deliver the next set of unicorns and head up the fortune 50 lists. The flexibility of microservice and serverless architecture on a granular level optimizes them for both the cloud and DevOps.
However, all of these environments pose a problem for the continuous monitoring of half of the DevOps equation. The distributed architecture of microservices and emerging serverless architectures (such as AWS and Azure) cause issues for traditional logging techniques and APM tools, and confound the ability of these tools to deliver quick root-cause analysis.
Too many logs to process
In most cloud-deployed, container-based, microservice, or serverless environments, Dev and Ops teams are flying blind. By splitting applications into component pieces, error logs become disaggregated, and many thousands of unstructured records are generated every minute.
Solutions can (maybe) be found, with an ability to trace issues back to a specific containerized location. But, the process is slow, and the practicalities make real root-cause error analysis and solutions nearly impossible.
The reality of logs is that if you know what to log, you have already identified the problem. With billions of instructions a second, you can’t record everything. This becomes even more complex with the deployment of microservices. Core dumps and logs only give you a snapshot at the point of failure of a specific process. Then you are forced to guess what happened, attempt to reproduce, redeploy and wait, sometimes with multiple iterations. This wastes time and rarely results in root cause fixes.
Massive delays
The result of an error is a significant delay. Ironically, this completely defeats the rapid deployment and more frequent release goals of a CI/CD approach to development. Even worse, the fault may only have been identified after impacting users (your customers) for some time — translating into lost revenue and a damaged reputation.
This is why in many modern CI/CD pipelines, there are extensive test phases that attempt to rigorously root-out errors before applications are released into production. However, this fails to take into account a central observation behind DevOps — you can never truly duplicate production environments in a test.
Failure to deliver on the promise of DevOps
DevOps is not about developing pristine code on the first try. It is about harnessing the complexity of reality to the benefit of application development. Traditional CI/CD approaches to monitoring cannot deliver this in the architecture built for DevOps.
Can software flight recorders deliver an observability solution?
Flight recorder software (record & replay) with the ability to simulate reverse execution of the process, so that the developer can go back in time, directly to the line of code where the error resides, is not so new. These tools are used by developers for close to a decade to improve the code quality released into production.
Often playing a role in test phases, or integrated directly into IDEs and the build phase, reverse debuggers record the exact steps taken by the code executing the application. The application execution is recorded, and the developer is given the ability to step back and forth through the execution stages, enabling them to go directly to the line of code where the error resides and make changes.
The incumbent software flight recorder solution
Led by companies like Undo, RevPDB, and Chronon, reverse debuggers are becoming a staple of modern application development. The fact that they deliver dynamic code analysis of runtime execution allows them to provide 100% reproducer of the issue as opposed to the false positives produced by static analysis tools.
The problem reverse debugging has always had is runtime performance impacts. Recording, storing, and delivering analysis is a resource-intense process — causing a 10x, 100x, or more slow down in application execution. Sometimes this performance slowdown can be absorbed in a test. However, this has ruled out the technology as an “always recording” solution for production deployments, until now.
A new approach to software flight recorder observability
Incumbent flight recorder solutions all instrument the application heavily at runtime. Recently, a new approach has come to market that instruments the application at compile-time, working with the compiler, so that runtime instrumentation requirement is almost zero. The result is a less than 10% performance impact out of the box, with optimization reducing it closer to zero — allowing these tools to operate in production environments.
Rather than sifting through thousands of decontextualized logs and guess what they tell you about the billions of instructions per second happening within your application, a true observability platform allows you to remove the guesswork and frustration. Dynamic code analysis delivers an exact reproduction of the execution of the application, decision making is improved, and arriving at a root-cause fix is accelerated dramatically.
Right now, RevDeBug is leading the charge in terms of delivering in production software flight recording platforms. Because code is looked at on a granular level, the distributed architecture of containers, remote device deployments, air-gapped environments, and serverless doesn’t matter. You are delivered full observability that can provide industry fastest root-cause analysis and allow cloud-native production environments to act as test grounds just like DevOps always intended.
Building a True Observability Platform for cloud-native, serverless
Taking software flight recorder platforms and dynamic code analysis into production environments is just the start of an innovation-driven future. Tech businesses (like RevDeBug) have built true observability platforms based around the flight recorder engine, adding features critical to deployments in cloud-native environments, including microservices, providing real-time recordings, and fastest root cause analysis.
DevOps and Executive monitoring tools deliver heat maps of global production deployments and errors, including a 100% reproducer of the error in real-time. Automated rollbacks can be initiated within milliseconds of a mistake. It is production monitoring, and industry fastest root-cause analysis rolled into one — taking the holistic view of an APM and integrating it with the granular specificity of a software flight recorder.
Recording in production failures provides the detailed information needed to feed data about production behavior back into the build phase, recording everything the program did. Dev teams can rapidly produce fixes, alterations, and improvements. This closes the loop within the DevOps toolchain, allowing the production environment to operate as DevOps has always intended it to — even using containers, serverless architecture, remote client devices, and even air-gapped environments.
The CI/CD pipeline of the future is already here
The ability of full observability platforms to bring transparency to cloud deployments, containers, air-gapped environments, and serverless means the handcuffs have been taken off DevOps. The missing piece of the DevOps pipeline is now complete. The tools needed for true cloud-native observability are here. The next stage is integrating those tools into your CI/CD pipeline and identifying how these changes will impact other elements of your DevOps workflow.
True observability in containers will likely accelerate CI/CD deployments. The rapid ability to respond to issues using dynamic code analysis means faster fixes and more confidence in cleaner code.
A considerable gap exists in the DevOps toolchain for dynamic analysis of code. It’sIt’s the missing piece of the workflow. Updated to remove impacts on performances, flight recording software perfectly fits this missing piece.
Reduced risk
The rollout of granular and containerized elements of an application into an environment over which DevOps teams have full observability removes risk. It provides the necessary insurance on-demand-enterprise needs to compete and retain customers.
With DevOps, each stage of application development is small, and the real production environment acts as the ultimate test ground. Performance impact is minimized, while data on how the application will behave is guaranteed. It is simple to roll back to stable versions, minimizing customer downtime. Everything is streamlined; everything is accelerated.
Improved outcomes
What the CI/CD pipeline of the future offers is a way to deliver DevOps strategies confidently in cloud-native environments. This is DevOps optimized — this is what True Observability Platforms and dynamic code analysis in production bring to the monitoring phase of CI/CD.
The big win is the on-demand enterprise. DevOps needs to step up their game and deliver for the bottom line. The tools of the future are here today. Now it is time to experiment with the processes and pipeline opportunities these innovations have introduced. It’s time to innovate!
{{cta(’70c008c7-354e-48d9-98c1-e860b22f3c7c’)}}