How to use Microsoft Visual Studio Diagnostic Tools with RevDeBug
Finding and fixing bugs isn’t easy. It can be like doing a puzzle, where several pieces are missing, you don’t know how it should look when finished and the only clues you’ve found online are in another language. Oh, and Google Translate doesn’t work.
That is what bug fixing can be like, at least until RevDeBug came along.
However, there are times when even RevDeBug only solves or highlights part of the problem. Developers need more information that supports and verifies what they see in the RevDeBug plugin in Microsoft Visual Studio.
Fortunately, several other options can provide the data required to track down the root of the problem and come up with a working solution. RevDeBug is a reverse debugger tool – a window, allowing you to see variables and return values of executed methods – to understand why those particular code paths were executed.
Diagnostic Tools
Alongside that, if you need extra support, it is the Microsoft Visual Studio Performance and Diagnostics hub, giving you a comprehensive performance analysis of a program while it’s running. Within this, are two useful performance tools: the CPU Usage tool and the Memory Usage tool, both designed to diagnose different issues, with it easy to use them in the same window as the debugger tool, thereby allowing developers to see the same problem from different angles.
Running alongside RevDeBug, these tools make it easier to monitor performance while debugging and reduces the time it takes to diagnose a bug or confirm a fix has worked.
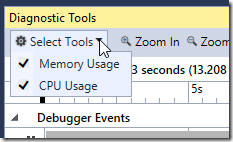
The diagnostic tools were first released in 2015, with the data provided in a graph timeline and more detail in the tabs below. Developers can access these in the Diagnostic Tools menu.
These diagnostic tools were always designed to operate separate from the debugger window, or Microsoft’s debugger tool, IntelliTrace.

Including the Memory Usage Tool makes it easier to investigate memory issues while debugging, allowing at-a-glance snapshots, using a graph format, with more detail, as shown below.
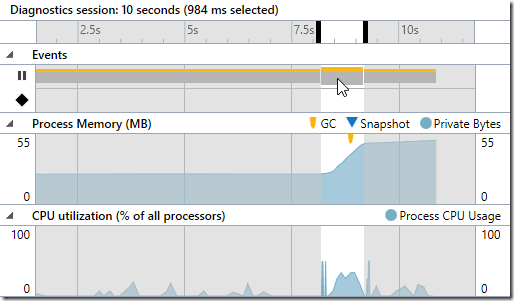
Developers can take snapshots before and after debug actions, with more data available, so that memory usage and growth can be analyzed. The CPU tool performs similarly, ensuring spikes in CPU usage are more comfortable to spot, mainly when a breakpoint occurs, which can drive CPU use higher when code isn’t working correctly.
Find out more about the benefits of reverse debugging.
Topmost artwork: copyright by Microsoft, producer of MS Visual Studio.